

How to Find Global Suppliers for the Baking Industry
Finding global suppliers for the baking industry requires more than comparing flour prices. It requires evidence, patience, and practical verification.
The global bakery market continues to expand across retail, foodservice, and industrial production. Industry reports from Grand View Research and Fortune Business Insights identify rising demand for packaged bread, frozen bakery products, clean-label goods, and convenient formats. Puratos’ 2024 Taste Tomorrow report surveyed more than 18,000 consumers across 44 countries. Its findings highlight stronger interest in health, freshness, sustainability, and transparent ingredients. These trends affect supplier selection directly. A low-cost cocoa, yeast, or grain supplier may fail if it cannot provide stable specifications, allergen controls, or reliable documentation.
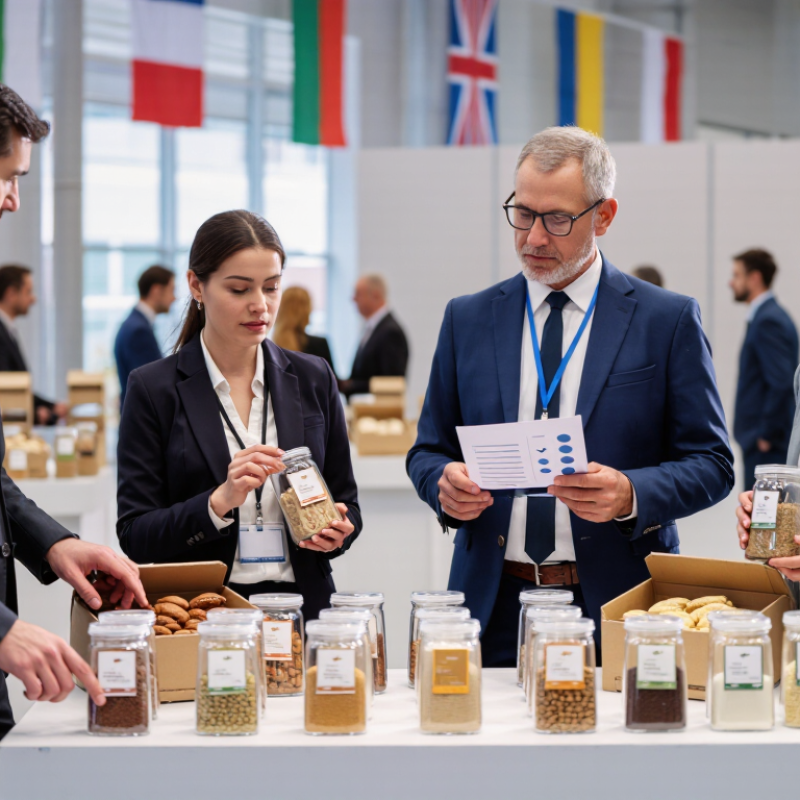
Robb MacKie, president and chief executive officer of the American Bakers Association, has emphasized, “Bakers are committed to providing safe, nutritious, and affordable food.” That responsibility should guide every sourcing decision. A dependable supplier should demonstrate food-safety certification, batch traceability, export experience, production capacity, and clear lead times. Request recent audit records, product samples, certificates of analysis, and references from comparable bakeries. Check whether the supplier can maintain quality during seasonal shortages or shipping delays.
Digital marketplaces can create useful leads. They cannot replace an audit. A polished website proves very little. I have seen sourcing plans focus heavily on unit price, then overlook minimum order quantities, port delays, or inconsistent moisture levels. That is an expensive mistake. A stronger approach combines trade fairs, verified supplier directories, laboratory testing, and small trial orders before signing long-term agreements.
Define Flour Sourcing Regions Using FAOSTAT’s 787.3 Mt Wheat Output in 2023
How to Find Global Suppliers for the Baking Industry
Define Flour Sourcing Regions Using FAOSTAT’s 787.3 Mt Wheat Output in 2023
FAOSTAT reported 787.3 million tonnes of wheat production in 2023. This figure provides a useful starting point for mapping flour sourcing regions. However, total output does not equal export availability. Some wheat supports domestic bread production, animal feed, or public reserves. Buyers should treat the number as regional context, not a ready-made supplier list.
Start by comparing production volume with milling capacity, port access, and wheat quality. Large output regions may offer strong supplier networks, but transport distances can raise costs. Coastal milling zones often simplify container planning. Inland suppliers may provide competitive prices, yet require extra rail or truck coordination. Ask suppliers for crop-year details, protein levels, moisture, ash content, and falling number results. These measurements affect dough strength, fermentation, and crumb structure.
Our first sourcing map looked precise, but it missed seasonal variation. A second review separated hard, soft, and durum wheat regions. That change produced more practical conversations with millers. It also exposed a weakness: FAOSTAT figures can be revised, and national reporting methods may differ. Verify each candidate through recent certificates, sample testing, production records, and independent logistics checks. Visit the mill when possible. A clean laboratory report is valuable. Direct observation is better. For baking companies, the best region is not always the largest producer. It is the region that consistently delivers suitable flour, transparent documentation, and workable lead times.
How to Find Global Suppliers for the Baking Industry - Define Flour Sourcing Regions Using FAOSTAT’s 787.3 Mt Wheat Output in 2023
| Sourcing Region | Representative Producing Country | 2023 Wheat Output (Mt) |
Share of Global Output | Typical Flour-Sourcing Strength | Procurement Consideration |
|---|---|---|---|---|---|
| East Asia | China | 136.59 | 17.4% | Large domestic wheat base and broad milling capacity | Check export availability, regional grades, and import regulations |
| South Asia | India | 110.55 | 14.0% | High-volume supply for general-purpose flour applications | Review export policy, protein level, moisture, and crop-year conditions |
| Eastern Europe and Black Sea | Russian Federation | 91.50 | 11.6% | Major export-oriented wheat-growing region | Assess sanctions, payment routes, insurance, and shipping risk |
| North America | United States of America | 49.31 | 6.3% | Distinct hard, soft, and durum wheat classes | Select wheat class according to bread, pastry, noodle, or pasta needs |
| Western Europe | France | 35.06 | 4.5% | Established milling and export infrastructure | Compare protein, falling number, alveograph, and delivery terms |
| North America | Canada | 31.95 | 4.1% | Strong hard red spring and durum wheat supply | Suitable for high-protein bread flour and selected pasta applications |
| South Asia | Pakistan | 28.16 | 3.6% | Regional wheat availability and proximity to Middle Eastern markets | Verify export permissions, milling consistency, and port logistics |
| Oceania | Australia | 25.96 | 3.3% | Export-focused supply serving Asian and Middle Eastern markets | Consider harvest timing, freight distance, and protein specifications |
| Eastern Europe | Ukraine | 23.00 | 2.9% | Important Black Sea grain origin with export experience | Evaluate security, port access, insurance, and alternative corridors |
| Western Europe | Germany | 21.46 | 2.7% | Reliable European grain and milling supply chain | Check EU food-safety requirements and mill-specific flour standards |
| West Asia | Türkiye | 22.00 | 2.8% | Strategic location between European, Asian, and Middle Eastern markets | Compare regional wheat blends, transit routes, and export documentation |
| South America | Argentina | 15.85 | 2.0% | Major Southern Hemisphere wheat origin | Use as a diversification option and assess crop-year quality data |
| Other producing countries and regions | 195.91 | 24.9% | Use for supplier diversification after checking local production, export capacity, quality specifications, and freight economics | ||
| Global wheat production benchmark | 787.30 | 100.0% | Reference volume for defining global flour-sourcing regions | ||
Source: FAOSTAT, Crops and livestock products, wheat production, 2023. Production values are shown in million tonnes and rounded to two decimal places; the “Other producing countries and regions” value is calculated as the global benchmark less the listed countries.
Related Posts
-

Why Is Bakery Production Important for Global Buyers?
-
2026 How to Choose an Industrial Bakery Equipment Supplier
-
How to Choose the Right Industrial Bakery Equipment?
-
China Top Bakers Bakery Equipment Suppliers?
-
How to Choose a Bakery Manufacturing Supplier in 2026
-

How to Start Your Own Bakers Bakery Business Successfully?